Utility metering platform
Water, gas, and electric meters with proven hardware from NWM, Rongxian, Xingyuan, and Sierjia—cloud dashboards end to end.
Water, gas, and electricity meters rarely share one vendor or protocol. Operators do not need another dashboard—they need clear definitions of abnormal, who acts, and when recovery happened, on screens they can trust during a shift.
This portfolio example summarizes an integrated monitoring platform TokyoScale designed and built for regional irrigation, pumping infrastructure, and urban gas distribution. It is one operational model—not a product brochure—showing how we tie field hardware to client-facing dashboards.
What gets connected
- Water — level, flow, remote pump/valve control, per-channel level meters and encoders
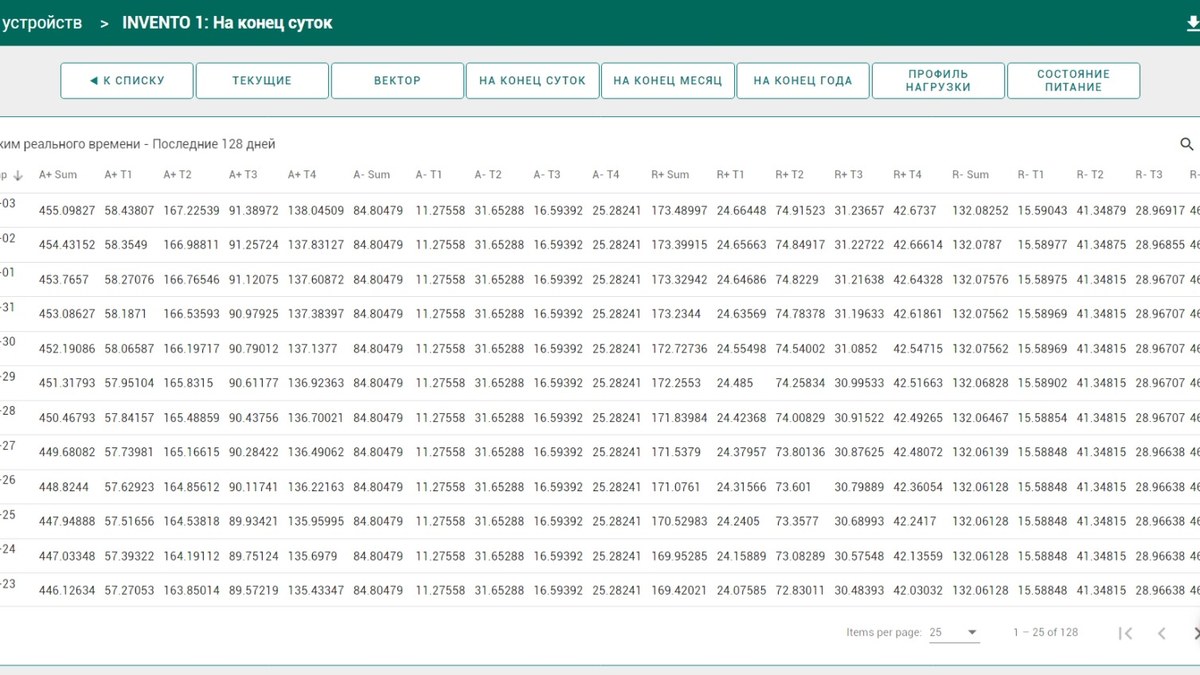
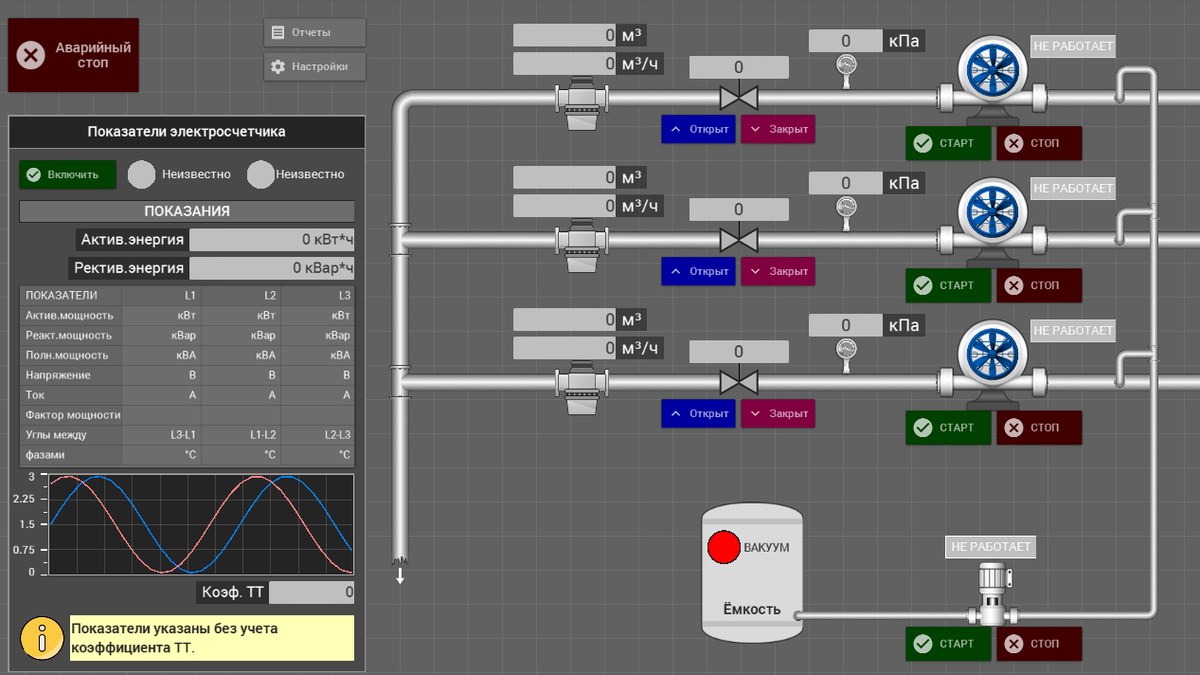
- Electricity — three-phase metering at pump stations: voltage, current, power factor, active/reactive energy
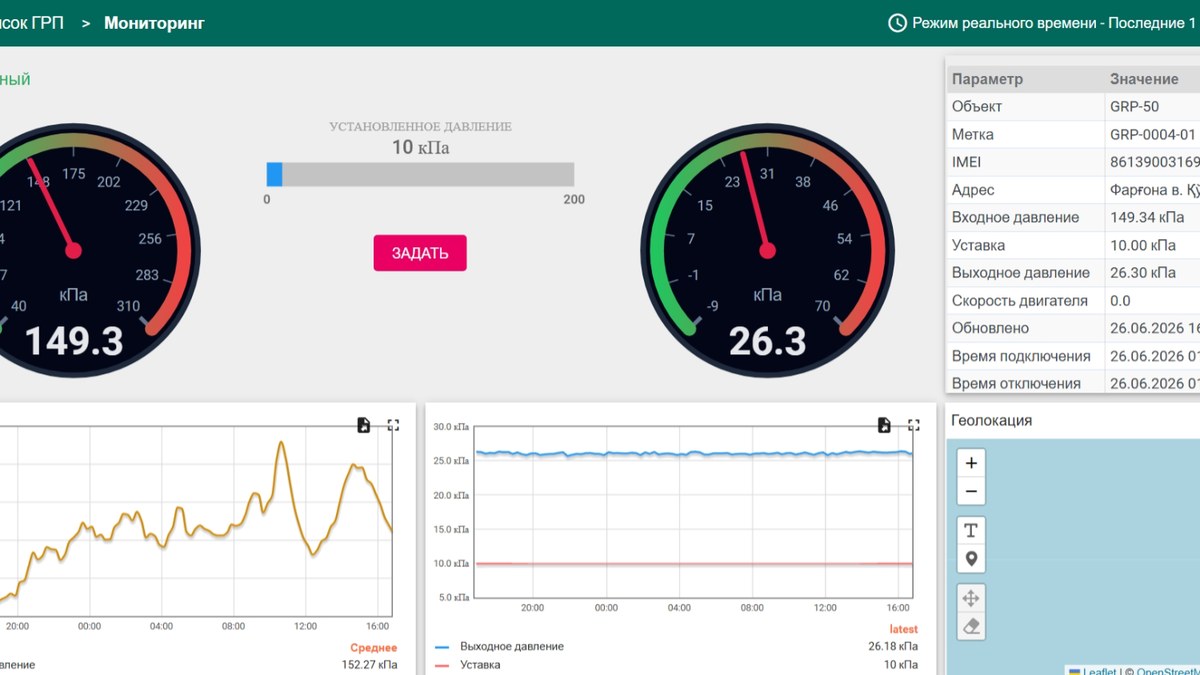
- Gas — gas regulation points (GRP): inlet/outlet pressure, remote setpoints, valve open/close state
- Connectivity — MQTT device registry (7,000+ endpoints), online status, last-seen timestamps
Field PLCs and gateways, cloud time-series storage, and operator web UIs are delivered as one coherent product experience.
Metering hardware (partner manufacturers)
We select proven instruments per deployment. Below are representative products we integrate (from each manufacturer’s catalog).
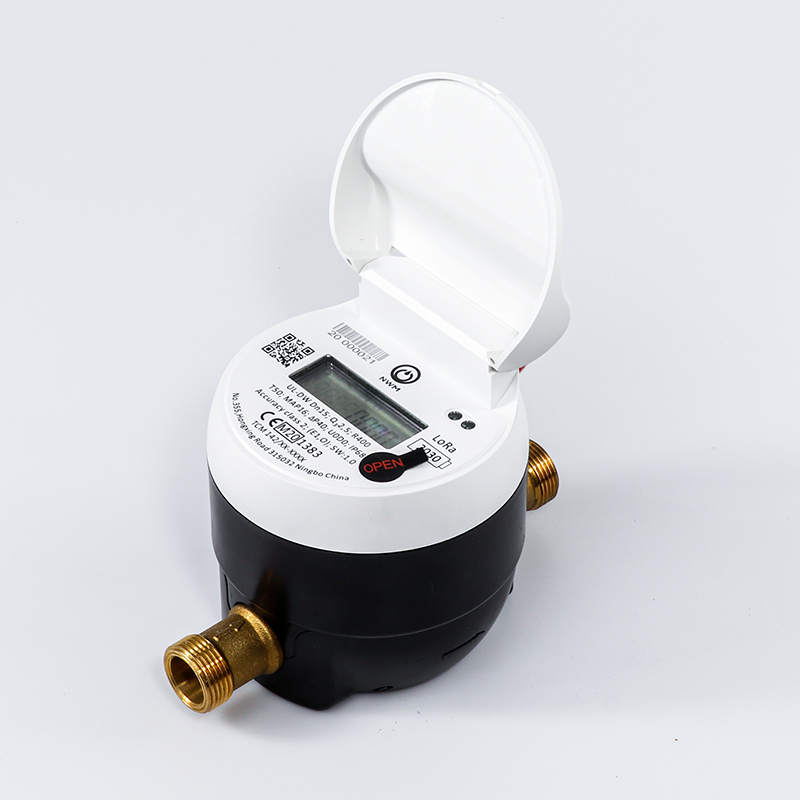
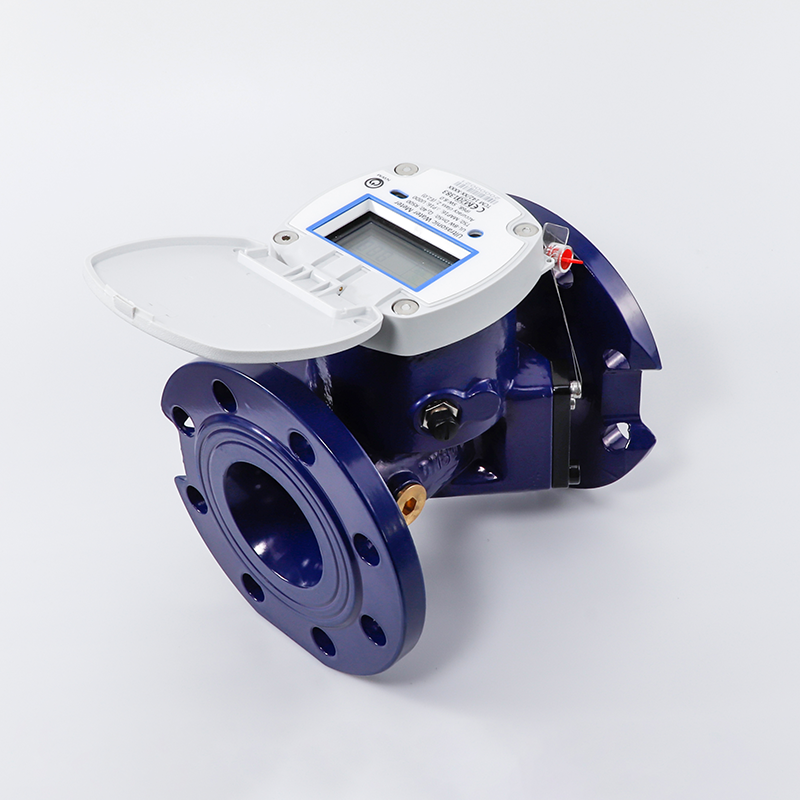
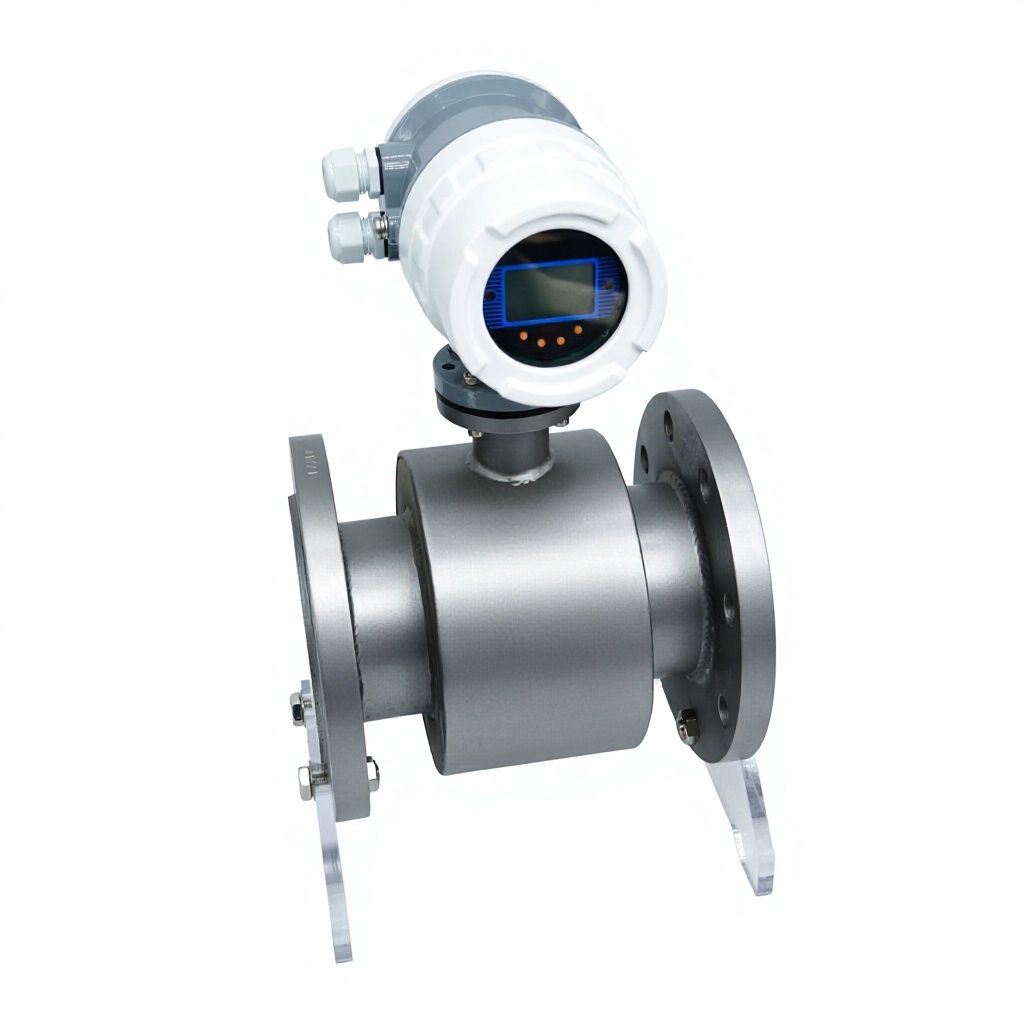
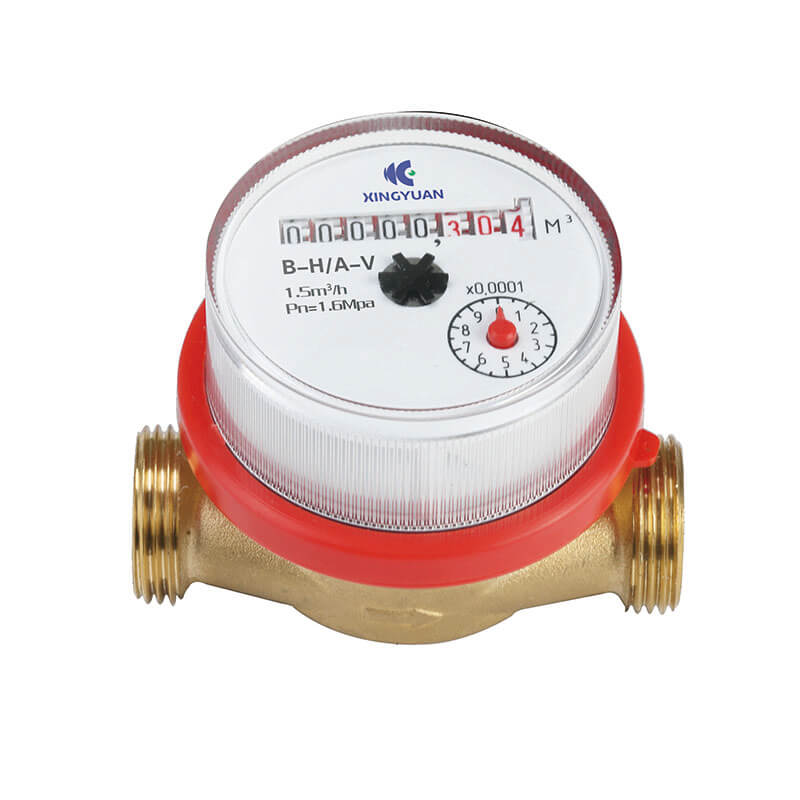
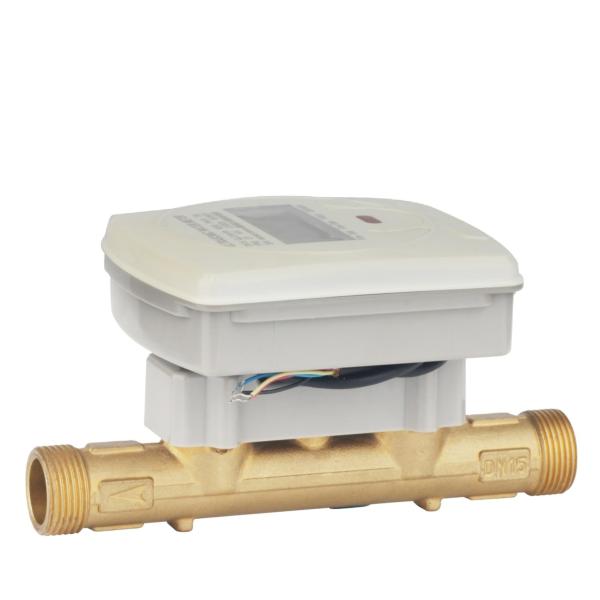
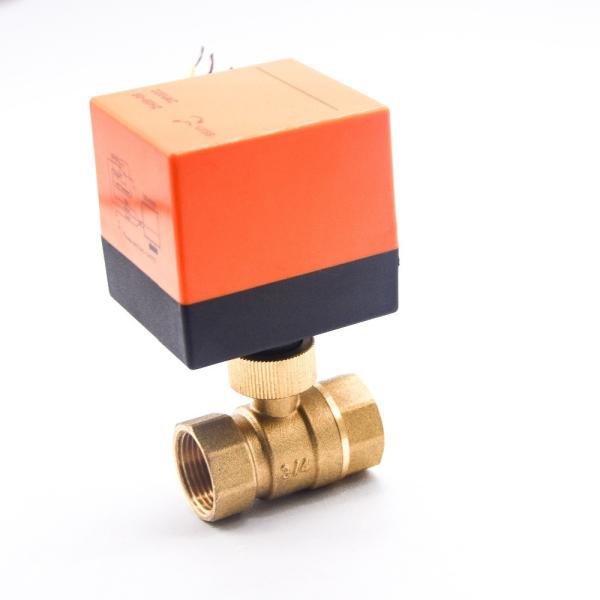
These meters and valves connect through MQTT gateways into the client dashboards and device registry below.
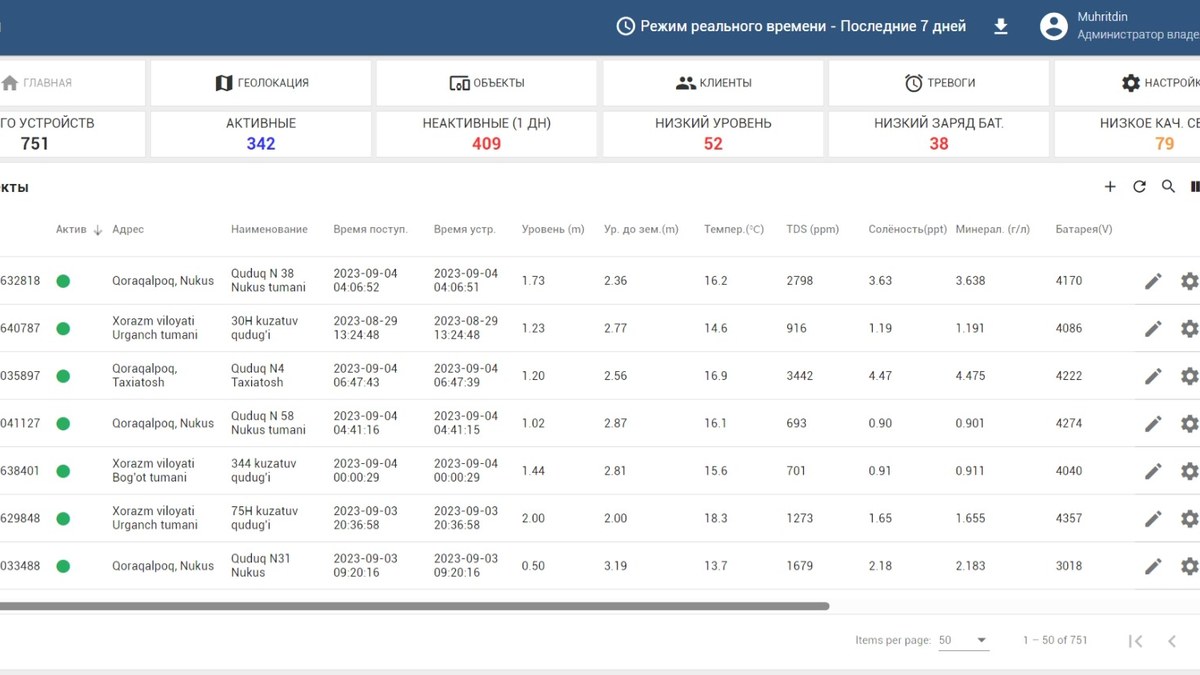
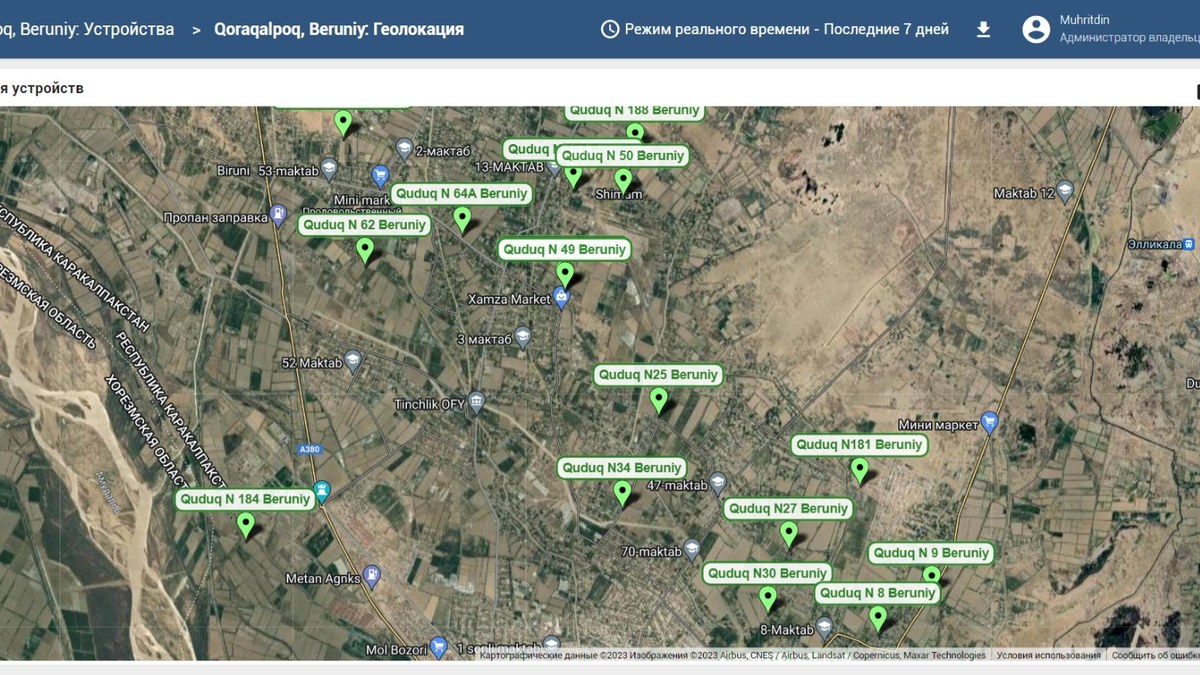
Client dashboards
One web application covers fleet operations, geolocation, gas regulation, meter readings, and pump-station HMIs. Below are real client-facing screens (region and language are localized per deployment).
Fleet overview — device registry and KPIs

Geolocation — field distribution
Gas — regulation points and valves
Meter readings — daily and monthly energy
Pumping — piping schematic and power metering
Design choices we keep
- Escalation before thresholds — define abnormal and notify paths before drawing charts
- Same numbers in the field and at HQ — align report intervals (10-minute to hourly) with live views
- Phased rollout — from one pump station to a regional device fleet, using templated screen design
For broader IoT and factory contexts, see our Manufacturing & factory operations brief. We can discuss similar patterns for leaks, losses, and offshore visibility.